Fund Overview
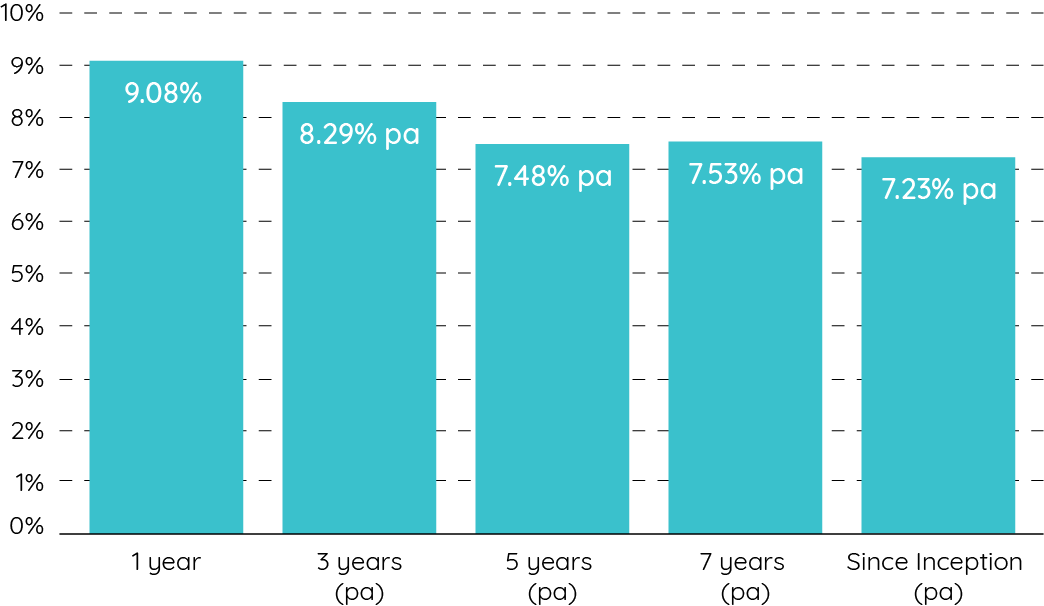
Performance
as at 30/06/20261
| 1 Month | 3 Month | 6 Months | 1 Year | 3 Years (pa) | 5 Years (pa) | 7 Years (pa) | 10 Years (pa) | Since Inception (pa)2 | |
|---|---|---|---|---|---|---|---|---|---|
| Total Return % | 4.94 | 2.46 | 3.02 | 7.55 | 6.56 | 8.25 | 7.81 | 8.17 | 7.55 |
| Average Market Exposure4 | 60% | 57% | 55% | 57% | 60% | 58% | 58% | 59% | 61% |
1 Fund Returns are calculated after fees and expenses and assume the reinvestment of distributions.
2 Inception date for performance calculation is 1 October 2005.
3 Past performance is not a reliable indicator of future performance.
4 Average Market Exposure calculated on delta-adjusted exposure of underlying portfolio.
Distribution History
| Frequency | End Period | Cents per Unit | Reinvestment Price |
|---|---|---|---|
| Quarterly | 30-Jun-26 | 21.14 | $5.1102 |
| Quarterly | 30-Mar-26 | 9.173 | $5.1941 |
| Quarterly | 30-Dec-25 | 7.4262 | $5.2570 |
| Quarterly | 30-Sep-25 | 8.51 | $5.2238 |
| Quarterly | 30-Jun-25 | 26.400 | $5.1902 |
| Quarterly | 31-Mar-25 | 1.7888 | $5.5518 |
| Quarterly | 31-Dec-24 | 8.5585 | $5.3207 |
| Quarterly | 30-Sep-24 | 5.3809 | $5.2890 |
| Quarterly | 30-Jun-24 | 17.3304 | $5.0482 |
| Quarterly | 31-Mar-24 | 7.1577 | $5.4311 |
| Quarterly | 31-Dec-23 | 9.8624 | $5.3614 |
| Quarterly | 30-Sept-23 | 5.80605 | $5.4423 |
| Quarterly | 30-Jun-23 | 8.1576 | $5.3852 |
| Quarterly | 31-Mar-23 | 5.370 | $5.308 |
| Quarterly | 30-Dec-22 | 5.45749 | $5.1011 |
| Quarterly | 30-Sept-22 | 8.97251 | $4.9652 |
| Quarterly | 30-Jun-22 | 14.1354 | $5.0013 |
| Quarterly | 31-Mar-22 | 5.5215 | $5.0036 |
| Quarterly | 31-Dec-21 | 5.2967 | $5.0779 |
| Quarterly | 30-Sep-21 | 6.1245 | $5.000 |
| Quarterly | 30-Jun-21 | 8.876 | $4.918 |

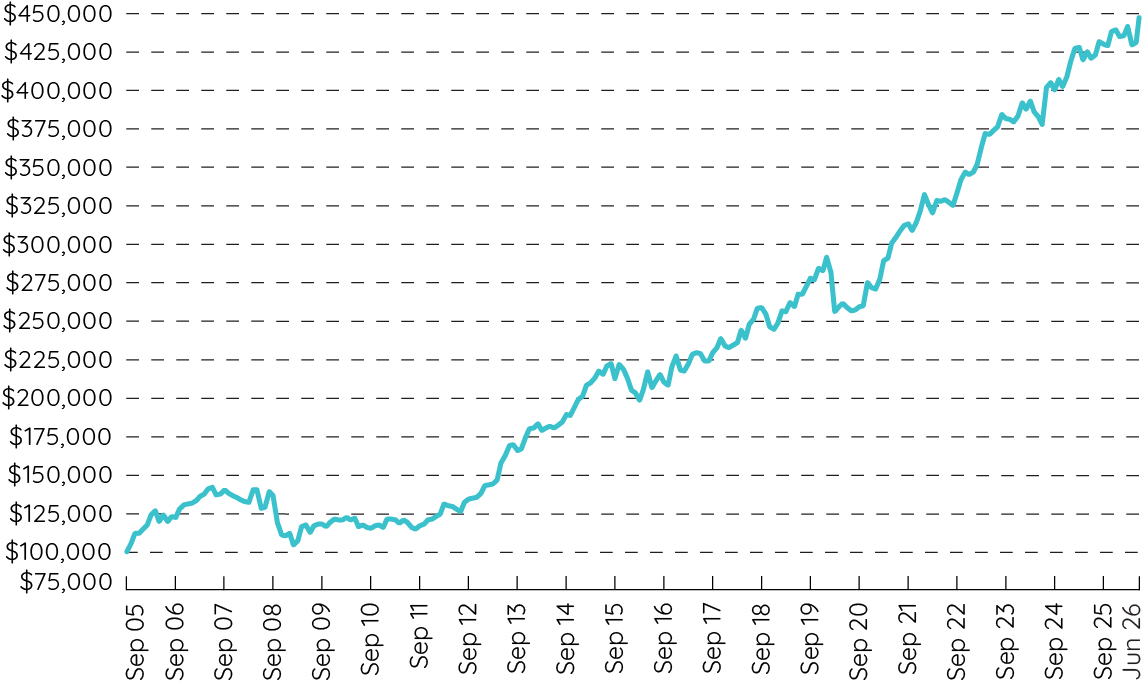
Growth of $100,000 since inception6
Annual Distributions7
6 Calculations are based on exit price, net of management fees and expenses and assumes reinvestment of distributions. Past performance is not a reliable indicator of future performance. 7 Illustrates Distribution Returns for the Talaria Global Equity Fund – Foundation Units as at 30 June 2026. Inception date is 1 October 2005.
Top 10 holdings8
| Company Name | Holding % | Country | Sector | Description |
|---|---|---|---|---|
| Bunzl | 5.3 | United Kingdom | Industrials | Multinational distribution and outsourcing business |
| Bayer | 5.2 | Germany | Health Care | Multinational pharmaceutical and life sciences company |
| Everest Group | 5.1 | USA | Financials | Leading global provider of reinsurance and insurance services |
| A. O. Smith | 4.9 | USA | Industrials | A leading manufacturer of water heaters in North America |
| Exor | 4.6 | Netherlands | Financials | A diversified holding company |
| Henkel | 4.4 | Germany | Consumer Staples | A multinational household products and adhesives company |
| Roche | 4.3 | Switzerland | Health Care | A global leader in cancer treatments |
| GSK | 4.2 | United Kingdom | Health Care | One of the world’s largest pharmaceutical companies |
| Newmont | 4.0 | USA | Materials | One of the top 3 gold producers in the world |
| Medtronic | 3.7 | USA | Health Care | A leading medical devices company |
8 Weightings include equity held and cash backing put options. It assumes that put options will be exercised. Should the put option not be exercised the cash will revert to the unencumbered cash portfolio or may be used to cover further put options.
Sector allocation10
Regional Allocation10
9,10 Weightings include equity held and cash backing put options. It assumes that put options will be exercised. Should the put option not be exercised the cash will revert to the unencumbered cash portfolio or may be used to cover further put options.
*USA includes American Depositary Receipts (ADRs) listings.
Fund Snapshot
| Management Fee | Nil |
| Liquidity | Daily |
| Min Investment | $50,000 |
| Availability | Wholesale Clients Only |
| Inception Date | 1 October 2005 |
| Buy / Sell Spread | 0.20% / 0.20% |
| Distributions | Quarterly |
Contact Us
Find out more by getting in touch with a member of our team
Join Our Mailing List
Join our Mailing list for all our latest news, insights and performance.
Wholesale Investor Confirmation
By clicking below you are confirming that you are an Australian wholesale client for the purposes of section 761G of the Corporations Act 2001. Access to this information is provided on the condition that it is not passed on to any person who is a retail client within the meaning of section 7610 of the Corporations Act 2001.